Category: Altcoin news

  • RAVE Token Crash Triggers Investigations as RaveDAO Denies Pump-and-Dump Allegations

    RAVE Token Crash Triggers Investigations as RaveDAO Denies Pump-and-Dump Allegations

    The RAVE token experienced extreme volatility after surging from approximately $0.25 to nearly $28 within nine days before crashing to below $4 on Saturday. At its peak, the token briefly ranked among the top 20 cryptocurrencies by market capitalization, surpassing several established digital assets. However, the sharp decline erased most gains, leaving the token trading near $1.06 and down more than 100% in a single day.

    RAVE price data :CoinGecko

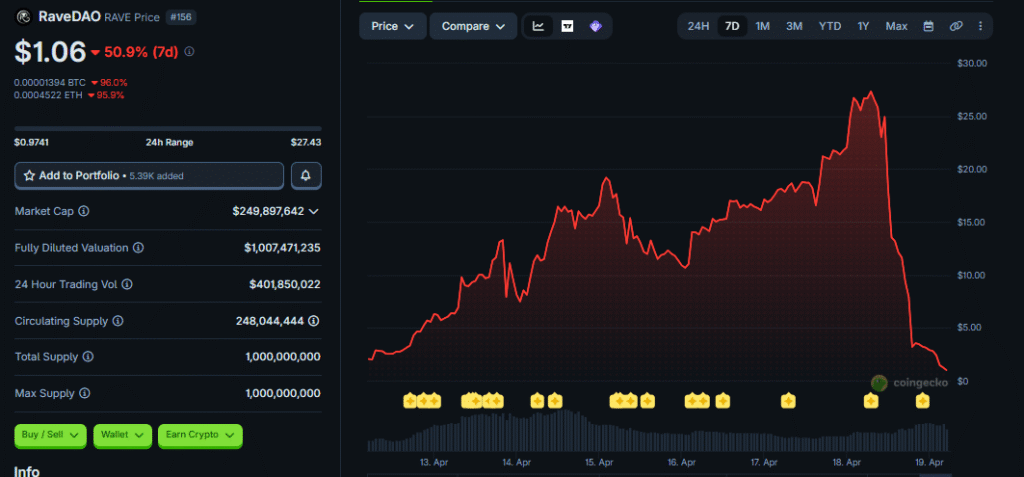
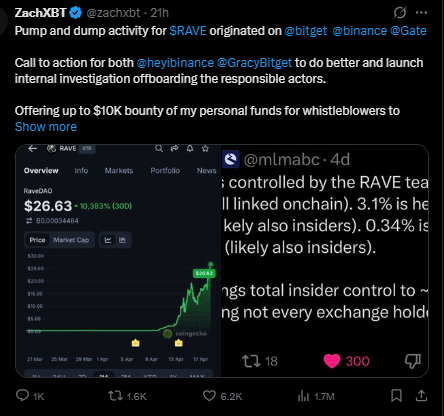
    The rapid price rise followed by a steep fall triggered widespread scrutiny within the crypto community. Onchain analyst ZachXBT publicly alleged a potential pump-and-dump scheme, highlighting claims that nearly 90% of the token’s 1 billion supply was held across three wallets linked to the project team. A $25,000 bounty has reportedly been offered to encourage whistleblowers to provide additional evidence.

    Exchanges Launch Investigations Into Suspicious Trading Activity

    Major cryptocurrency exchanges Binance and Bitget confirmed they have launched investigations into the unusual trading patterns surrounding the RAVE token. Officials from both platforms stated they are reviewing transaction flows and market behavior to determine whether manipulation occurred during the rally.

    Bitget CEO Gracy Chen said on X ;

    RaveDAO responded through public statements denying responsibility for the sudden price movement. The team stated it was aware of speculation but insisted it had not participated in activities designed to influence the token’s market value.

    Token Supply Structure and Project Funding Plans Under Scrutiny

    In its response, RaveDAO acknowledged plans to sell portions of unlocked tokens to support operations, marketing and development activities. The team also indicated it is exploring mechanisms such as price-triggered token locks to improve transparency and maintain alignment between project growth and token performance.

    The controversy has increased regulatory and investor attention on token supply distribution and liquidity management, highlighting ongoing risks in emerging Web3 ecosystems.

    Disclaimer

    This content is for informational purposes only and does not constitute financial, investment, or legal advice. Cryptocurrency trading involves risk and may result in financial loss.

  • Solana Gains 4% but Range Resistance Still Caps Momentum as Traders Watch Breakout Signals

    Solana Gains 4% but Range Resistance Still Caps Momentum as Traders Watch Breakout Signals

    Solana posted a roughly 4% gain, moving in line with strength seen in Bitcoin and Ethereum. Despite the upward move, the broader technical structure continues to show range-bound behavior rather than a confirmed breakout trend.

    $SOL 4h price chart

    Recent price action reflects steady buying momentum, with SOL advancing from the lower section of the range toward the upper resistance band. However, the structure visible on the chart suggests that the market has not yet broken beyond its established consolidation zone.

    Key Resistance and Support Levels Traders Are Watching

    The primary resistance zone remains between $92 and $94, an area that has rejected price several times during previous attempts. A decisive close above this level, supported by stronger volume, would signal a potential breakout and shift in short-term trend direction.

    On the downside, $78 to $80 continues to act as major structural support, while the $84 to $85 region serves as mid-range support that could attract buyers during pullbacks.

    Technical Outlook Remains Dependent on Breakout Confirmation

    Until SOL clears resistance with sustained volume, the current move is likely to remain part of consolidation. Traders are now watching for either a confirmed breakout above resistance or another rejection that keeps price locked within the existing range.

    Disclaimer

    This content is for informational purposes only and does not constitute financial, investment, or legal advice. Cryptocurrency trading involves risk and may result in financial loss.

  • XRP Price Holds Above Key Support as Traders Watch $1.44 Resistance Breakout

    XRP Price Holds Above Key Support as Traders Watch $1.44 Resistance Breakout

    XRP recorded a modest but steady advance, gaining about 3% over the past day and roughly 8% during the week. The move placed XRP ahead of both Bitcoin and Ethereum, signaling improving relative strength without the sharp volatility typically seen in breakout rallies.

    $XRP daily price chart

    Price action showed XRP climbing toward the $1.43 level through gradual higher lows rather than sudden spikes. This controlled upward movement suggests accumulation rather than speculative momentum, keeping traders focused on whether the token is building strength for a larger directional shift.

    Key XRP Support and Resistance Levels Guide Market Sentiment

    Market participants are closely tracking the $1.44 resistance level, which has repeatedly capped upward attempts. On the downside, the $1.40 support zone remains critical in maintaining the current bullish structure.

    XRP is now trading above its 200-day exponential moving average (EMA), a technical signal often viewed as constructive for longer-term trends. However, analysts note that trading volume remains inconsistent, preventing confirmation of a decisive breakout above resistance.

    Technical analysts highlight XRP’s developing multi-year structure as a potential early sign of a broader market rotation. The token is currently retesting a structural zone associated with previous cycle expansions, drawing renewed attention from traders looking for trend reversal signals.

    Disclaimer

    This content is for informational purposes only and does not constitute financial, investment, or legal advice. Cryptocurrency trading involves risk and may result in financial loss.

  • XRP Leads Weekly Crypto Gains but Low Volume Signals Consolidation Risk

    XRP Leads Weekly Crypto Gains but Low Volume Signals Consolidation Risk

    XRP has emerged as the top weekly performer among major cryptocurrencies, gaining about 5.4% over the past seven days and outperforming both Bitcoin and Ethereum. The token’s gradual climb reflects selective capital rotation into higher-beta assets rather than a broad-based market rally.

    $XRP 4h price chart

    Price action shows XRP rising steadily toward $1.43–$1.44, maintaining a controlled upward structure throughout the week. The move developed without sharp spikes, suggesting accumulation by traders rather than speculative momentum. However, the token has struggled to break through the $1.44 resistance level, which continues to cap upside attempts.

    Muted Trading Volume Raises Risk of Short-Term Pullback

    Despite relative strength, trading volume remains subdued at roughly 70% of the weekly average, limiting confidence in a sustained breakout. Analysts view this low-volume environment as a sign of consolidation rather than a decisive bullish shift.

    Technically, XRP continues to form higher lows, indicating underlying buying interest. However, without stronger participation, upward momentum may fade if broader market sentiment weakens.

    Key levels remain critical for short-term direction. A decisive break above $1.44 could confirm continuation of the upward trend, while holding support near $1.40 is essential to maintain the current structure. Continued weak volume increases the likelihood of consolidation or a modest pullback in the near term.

    Disclaimer

    This content is for informational purposes only and does not constitute financial, investment, or legal advice. Cryptocurrency trading involves risk and may result in financial loss.

  • XRP Tests $1.38 Resistance as Rakuten Integration Drives Japan Payment Adoption

    XRP Tests $1.38 Resistance as Rakuten Integration Drives Japan Payment Adoption

    XRP moved toward $1.38 after news that Rakuten integrated the token into its payments ecosystem, bringing new utility to millions of users. The integration allows roughly 44 million users to spend XRP across more than 5 million merchants, while also enabling customers to convert loyalty points into XRP through Rakuten Wallet.

    $XRP 4h price chart

    This development links XRP to one of Japan’s largest loyalty systems, where more than $23 billion worth of reward points are actively circulating. The move strengthens XRP’s presence in Asia and builds on earlier partnerships such as SBI Ripple Asia, which has supported regional blockchain payment adoption.

    XRP Price Rally Faces Resistance After Brief Breakout

    Price action showed XRP rising from $1.32 to $1.38, breaking above the $1.325–$1.33 resistance zone with strong trading volume. However, the rally struggled to sustain momentum and pulled back slightly to around $1.35, suggesting hesitation near resistance.

    Market activity indicates that the rally was supported by steady accumulation rather than sudden price spikes. Whale buying and rising open interest signals suggest growing institutional participation behind the move, although broader market sentiment remains cautious.

    Traders are closely monitoring $1.37 as a key pivot level. Holding above this level would support continuation toward the $1.40–$1.42 resistance range, which is viewed as the threshold for confirming stronger bullish momentum.

    Disclaimer

    This content is for informational purposes only and does not constitute financial, investment, or legal advice. Cryptocurrency trading involves risk and may result in financial loss.

  • XRP Falls to $1.33 After Heavy Selling as Bitcoin Weakness Pressures Major Cryptos

    XRP Falls to $1.33 After Heavy Selling as Bitcoin Weakness Pressures Major Cryptos

    XRP dropped sharply to $1.33 after a sudden wave of selling pushed the token below important support levels. The decline began with XRP trading near $1.36, before falling within minutes on unusually high trading volume, indicating aggressive selling rather than a temporary liquidity shortage.

    $XRP 3h price chart

    Over the past 24 hours, XRP declined about 1.8%, but the most significant move occurred during the intraday breakdown. Once the $1.35 support level failed, selling accelerated rapidly, reflecting fragile market conditions and shallow order books that allow prices to move quickly during selloffs

    Weak Bounce Reinforces Bearish Structure

    Following the sharp drop, XRP attempted a recovery but failed to regain lost ground. The price formed a lower high, while trading volume weakened during the rebound, suggesting limited buying interest. The $1.35 level has now turned into immediate resistance, while the $1.40 to $1.41 zone continues to cap recovery attempts.

    Market indicators remain mixed, with volatility compressing even as price momentum weakens. This combination often precedes a larger price move, though the direction remains uncertain.

    If XRP fails to hold the $1.33 support level, analysts warn that the next downside targets could fall within the $1.32 to $1.31 demand zone, keeping the broader downtrend intact.

    Disclaimer

    This content is for informational purposes only and does not constitute financial, investment, or legal advice. Cryptocurrency trading involves risk and may result in financial loss.

  • XRP Shows Early Bottom Signals as Traders Watch Key $1.30 Support Level

    XRP Shows Early Bottom Signals as Traders Watch Key $1.30 Support Level

    XRP has remained in an eight-month downtrend, but multiple technical and onchain signals now suggest that selling pressure may be weakening. Analysts are closely watching whether the $1.25–$1.30 support zone continues to hold, as this level has become critical for short-term price direction.

    $XRP daily price chart

    Data from shows the XRP/BTC relative strength index (RSI) has dropped to 24, its most oversold reading since October 2025. Historically, similar RSI levels have preceded strong reversals, with past recoveries delivering gains of 65% to more than 300% against Bitcoin.

    The XRP/BTC pair is also trading within a long-term consolidation range that previously acted as a launch zone for major rallies, including a 92% surge in XRP price during mid-2025.

    Onchain Metrics Indicate Accumulation Phase

    According to Glassnode, XRP’s MVRV Z-score is currently near zero, a level typically associated with market bottoms and reduced selling pressure as most holders sit near breakeven. Similar conditions in past cycles 2021, 2022, and 2024 were followed by significant upward moves.

    XRP MVRV Z-score vs. price

    Key Support at $1.30 Remains Critical for Bulls

    Traders emphasize that XRP must hold above the $1.25–$1.30 range to maintain bullish structure. If this support remains intact, a short-term rebound toward $1.45 is considered possible. However, a breakdown below $1.15 could expose the asset to deeper losses, with downside targets near $0.80 based on historical demand zones and technical patterns.

    Overall, current indicators suggest XRP may be stabilizing, but confirmation depends on whether buyers can defend key support levels in the coming sessions.

    Disclaimer

    This content is for informational purposes only and does not constitute financial, investment, or legal advice. Cryptocurrency trading involves risk and may result in financial loss.

  • XRP Falls 4% as Selling Pressure Intensifies Despite ETF Inflows

    XRP Falls 4% as Selling Pressure Intensifies Despite ETF Inflows

    XRP slipped roughly 4% on April 9, 2026, falling from around $1.37 to $1.33 as persistent selling pressure outweighed modest institutional inflows. Market data shows traders used short-term rallies to exit positions rather than build new ones, reinforcing signs of continued weakness in the asset’s short-term structure.

    $XRP3h price chart

    Ripple-linked investment products recorded $3.32 million in ETF inflows, marking a shift from outflows seen in March. However, the inflows were not strong enough to stabilize prices. At the same time, exchange liquidity has thinned noticeably, increasing the likelihood of sharper price swings if key technical levels are broken.

    Technical Signals Point to Ongoing Distribution Phase

    Recent price action indicates a distribution pattern, with XRP repeatedly failing to hold gains above resistance levels between $1.37 and $1.38. Rising trading volume alongside falling prices further confirmed strong selling activity. The decline accelerated after rejection near $1.38, with late-session volatility pushing the token briefly to $1.31 before minor stabilization.

    Traders are closely monitoring immediate support at $1.33, with stronger downside risk emerging if price falls below the critical $1.28 level. On the upside, XRP must reclaim $1.35 and then break above $1.38 to restore positive short-term momentum and signal a potential shift in market sentiment.

    Disclaimer

    This content is for informational purposes only and does not constitute financial, investment, or legal advice. Cryptocurrency trading involves risk and may result in financial loss.

  • Canary Capital Files Application for Spot PEPE ETF in the United States

    Canary Capital Files Application for Spot PEPE ETF in the United States

    Canary Capital has submitted a Form S-1 application to the U.S. Securities and Exchange Commission seeking approval to launch a spot exchange-traded fund tied to the PEPE memecoin. The proposed product, named the CANARY PEPE ETF, is designed to track the price performance of the Pepe token by holding the asset directly through a designated custodian.

    According to the filing, the ETF trust may allocate up to 5% of its assets to Ether in order to cover transaction fees associated with activity on the Ethereum blockchain. The move highlights the operational requirements of maintaining blockchain-based assets within a regulated investment structure.

    Canary Capital already offers several cryptocurrency-related ETF products linked to assets such as XRP, Solana, Hedera, and Sei. In November 2025, the firm also submitted an application for an ETF tracking Mog Coin, a smaller memecoin ranked significantly below PEPE by market capitalization.

    Market Risks and Concentration Raise Investor Concerns

    The proposed ETF arrives at a time when PEPE remains significantly below its previous peak. The token is currently down nearly 85% from its December 2024 all-time high of $0.00002368. Despite the decline, the token continues to maintain a large user base, with approximately 513,392 holders recorded on blockchain data platforms.

    Pepe is up 6.06% over the past 30 days

    The filing also highlighted ownership concentration risks, noting that as of January 2026, the ten largest PEPE wallet addresses controlled about 41% of the circulating supply. Such concentration could increase price volatility and impact investor confidence.

    Regulatory developments remain a key factor in determining the pace of new ETF launches. Canary Capital noted in its filing that rules governing the use of the Pepe token and Ethereum network in the United States continue to evolve, which could influence both adoption and long-term demand for the asset.

    Disclaimer

    This content is for informational purposes only and does not constitute financial, investment, or legal advice. Cryptocurrency trading involves risk and may result in financial loss.

  • XRP Surges 5% Amid Bitcoin Rally, Trend Reversal Remains Unconfirmed

    XRP Surges 5% Amid Bitcoin Rally, Trend Reversal Remains Unconfirmed

    XRP rose roughly 5% to break above the $1.38 resistance level, fueled by strong volume and notable whale accumulation. The surge coincided with broader crypto strength, particularly bitcoin’s rally past $72,000, yet the broader downtrend in XRP suggests the breakout may be tactical rather than a confirmed trend reversal.

    $XRP 4h price chart

    The move from $1.32 to $1.38 reflected sustained buying rather than a single spike, signaling growing participation. Whale accumulation and rising open interest support the momentum, but broader bearish structural patterns remain, limiting long-term conviction. ETF outflows and realized losses indicate that investor sentiment remains mixed despite short-term gains.

    Ripple’s Institutional and Asian Market Push

    Ripple is positioning XRP within the expanding stablecoin ecosystem, with on-chain stablecoin volume expected to reach $33 trillion by 2026. Partnerships in Japan, including SBI Ripple Asia, underscore growing institutional adoption in Asia, reinforcing XRP’s strategic role beyond short-term trading.

    Key Levels to Watch

    The $1.37 pivot is critical: holding above it keeps the breakout intact, while the $1.40–$1.42 zone represents a meaningful test for momentum continuation. A drop back below $1.32–$1.30 would likely invalidate the breakout, returning XRP to its previous trading range. Traders are closely monitoring volume and whale activity to gauge whether the move can evolve into a structural trend shift.

    Disclaimer

    This content is for informational purposes only and does not constitute financial, investment, or legal advice. Cryptocurrency trading involves risk and may result in financial loss.