
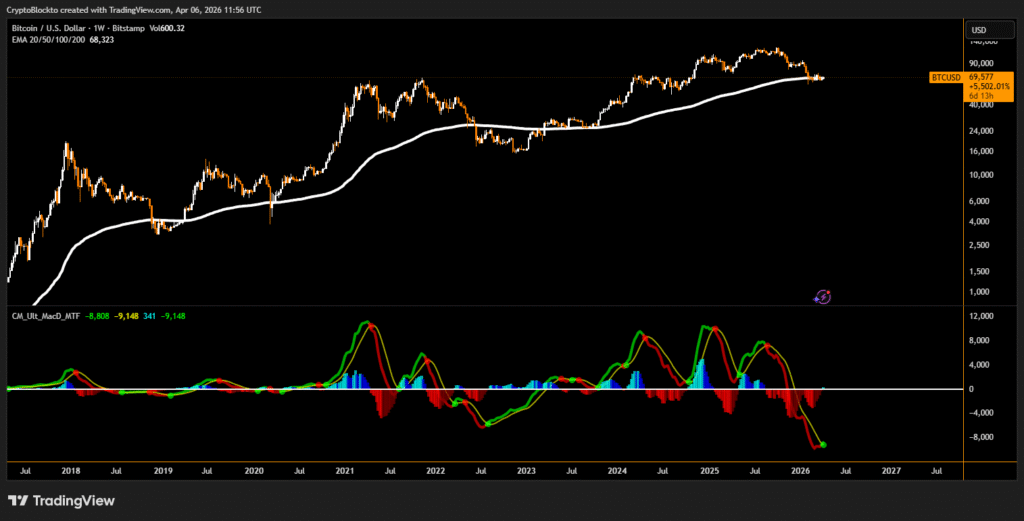
Bitcoin faces a decisive week as macro tensions collide with signs of a potential long-term bullish reversal. The weekly chart shows Bitcoin reclaiming the 200-week exponential moving average (EMA), while the moving average convergence/divergence (MACD) indicator is close to producing its first bullish cross since May 2025. During the last similar signal, Bitcoin surged from $94,000 to $119,000 within two months.
MACD Indicator and Liquidation Activity Drive Market Focus
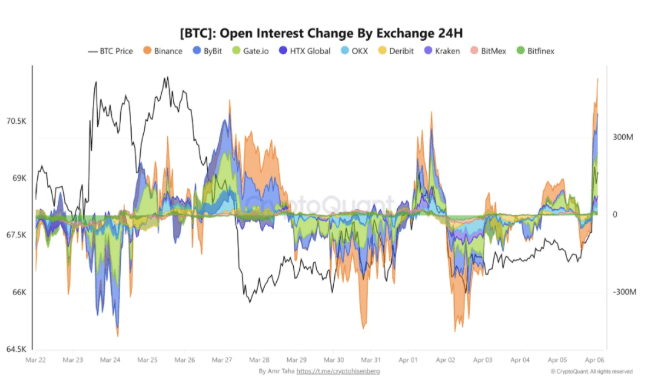
Analysts note that Bitcoin recently moved above $70,000, triggering more than $250 million in liquidations as short positions were caught off guard. Onchain data shows aggressive short term positioning, with increased open interest and trading volume, particularly on Binance. Some traders expect potential liquidity hunts near the $64,000 to $64,500 range, signaling possible downside pressure before further gains.
Macro Risks and Inflation Data Add Volatility
Geopolitical tensions surrounding US-Iran developments remain a major concern, especially as US President Donald Trump set a deadline related to reopening the Strait of Hormuz. Oil prices have climbed above $115 per barrel, raising concerns that inflation could increase.
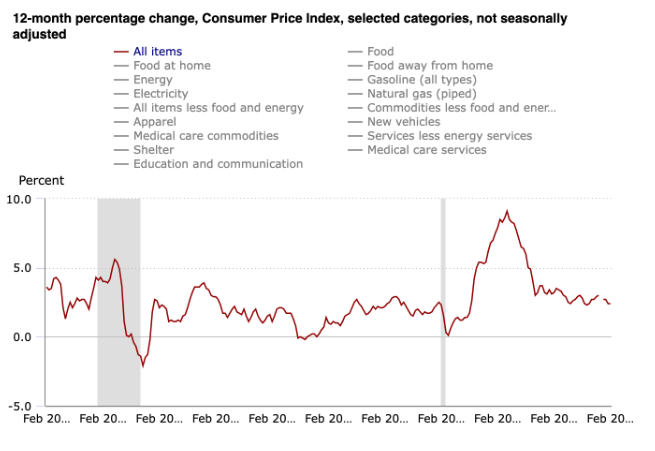
Markets are also awaiting key US inflation indicators, including the Personal Consumption Expenditures (PCE) Index and Consumer Price Index (CPI). Analysts estimate CPI could rise to around 3.7% if elevated oil prices persist, adding uncertainty to Bitcoin’s short-term direction.
Disclaimer
This content is for informational purposes only and does not constitute financial, investment, or legal advice. Cryptocurrency trading involves risk and may result in financial loss.
Leave a Reply