Category: Bitcoin news

  • Bitcoin Price Risks New Lows Unless $76K Turns Into Strong Support

    Bitcoin Price Risks New Lows Unless $76K Turns Into Strong Support

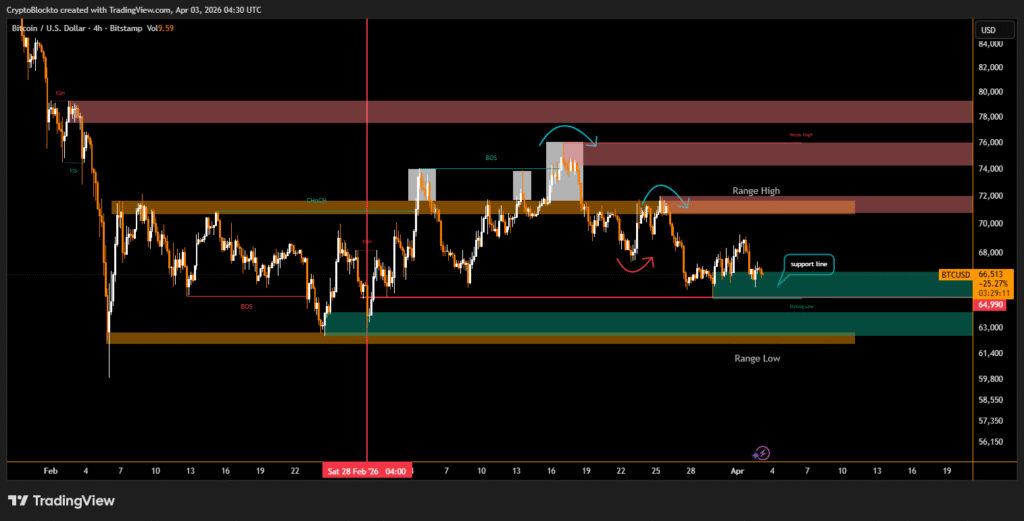
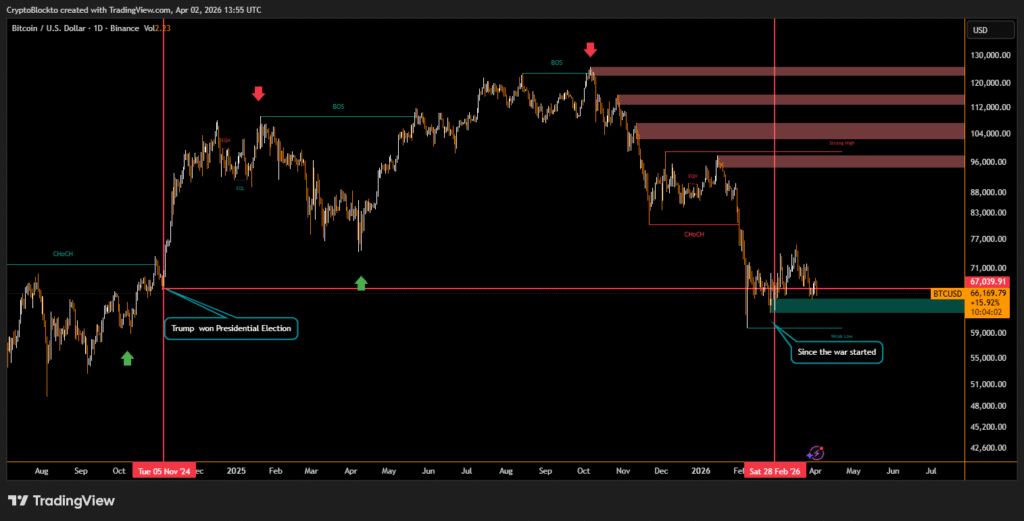
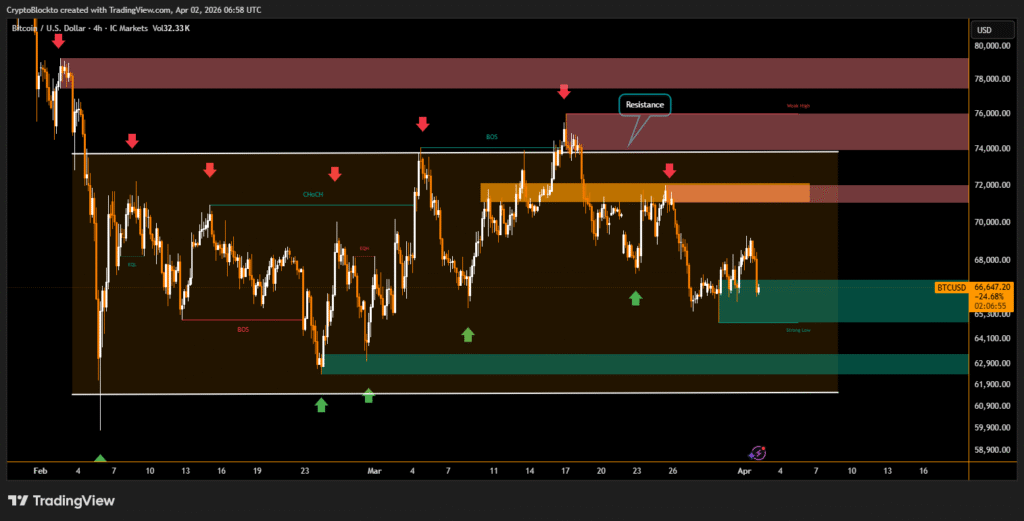
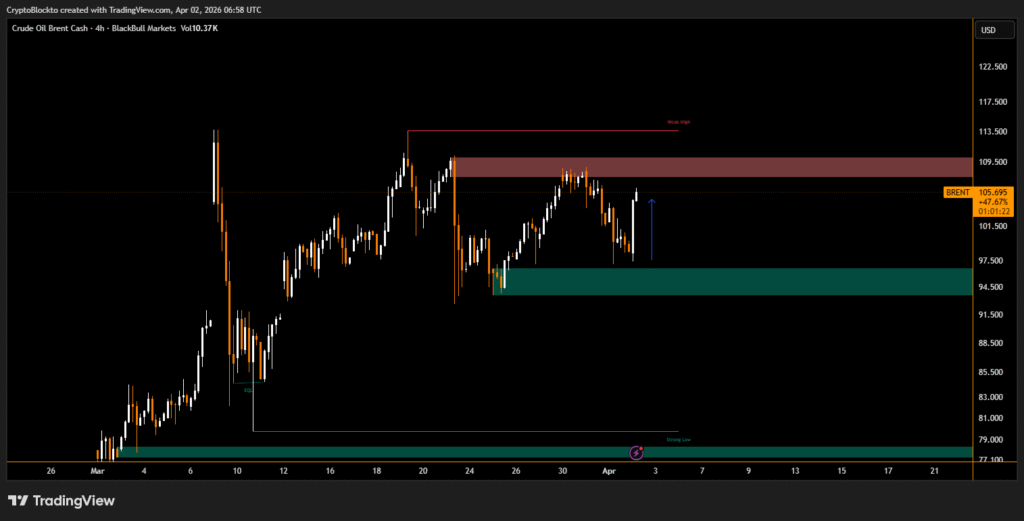
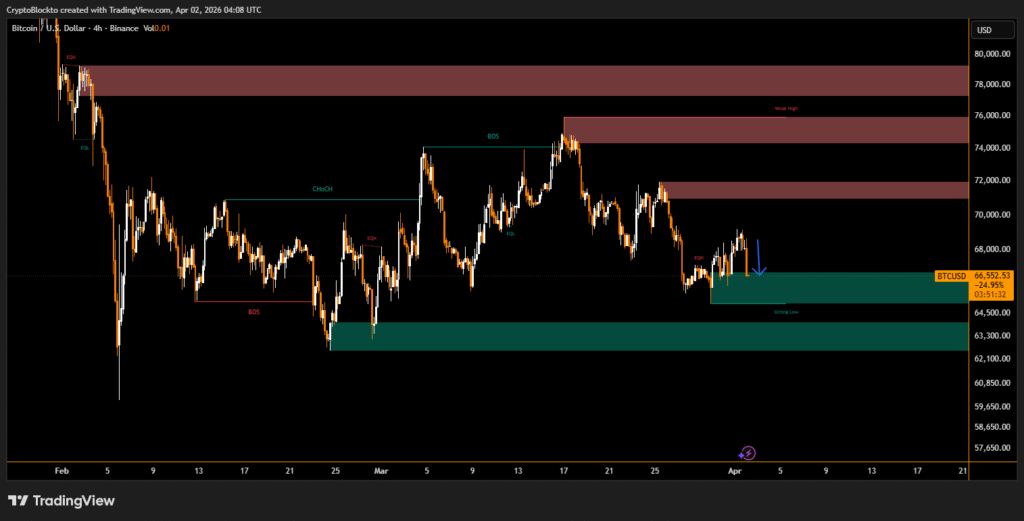
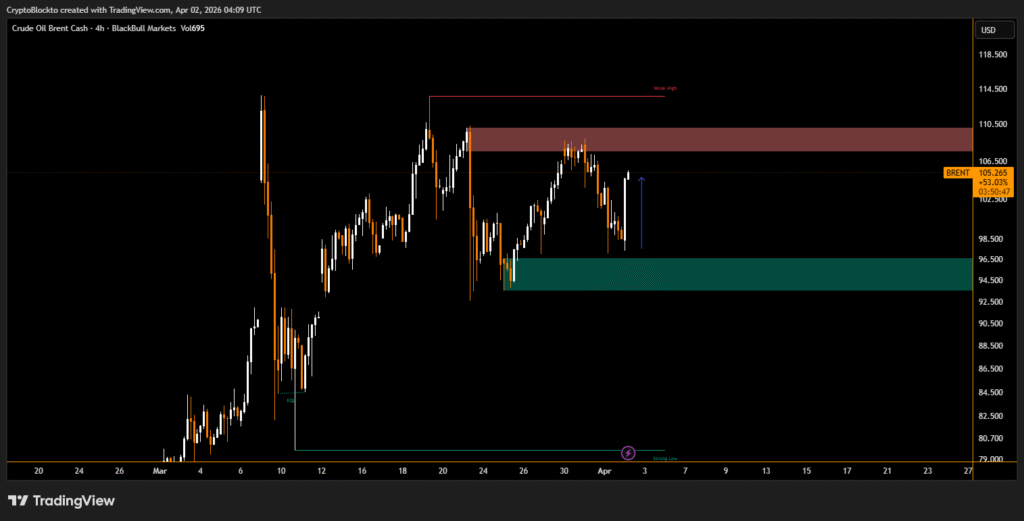
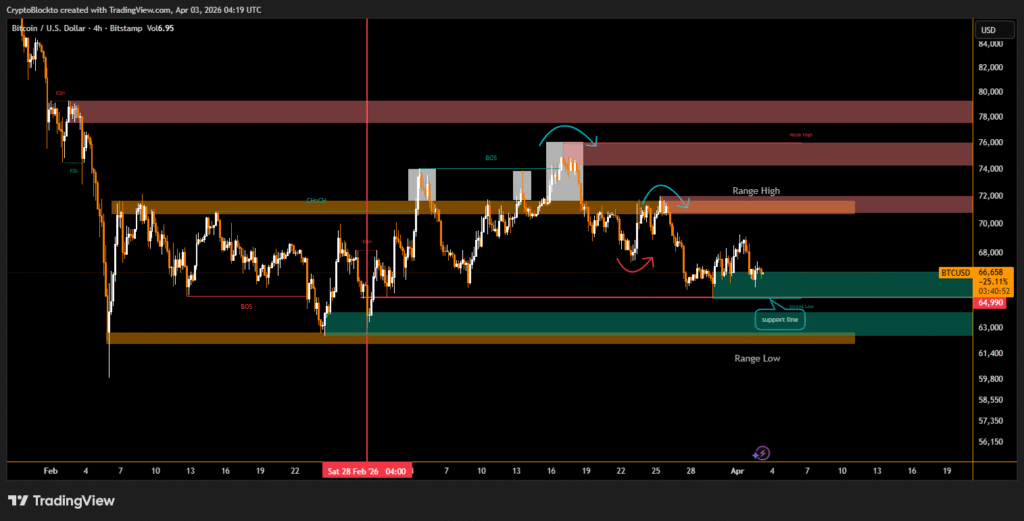
    Bitcoin continues trading within a tight $60,000 to $73,000 range, showing resilience despite challenging global conditions. Rising Brent crude oil prices to levels last seen in 2008, ongoing conflict involving the United States, Israel and Iran, and volatility in traditional markets including a 3.95% year-to-date decline in the S&P 500 have created a difficult backdrop.

    $BTC 4h price chart

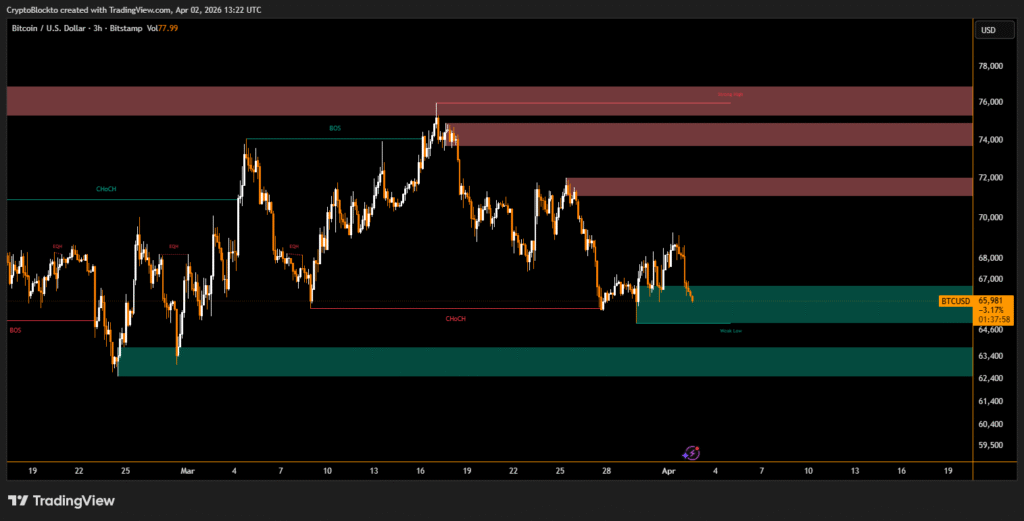
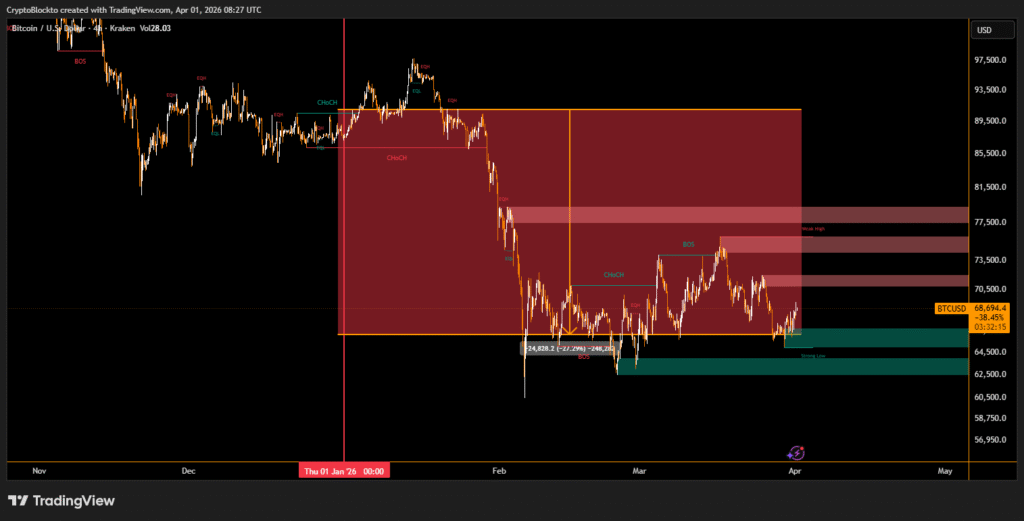
    Buyers have repeatedly stepped in near the $60,000 level, keeping it intact as a key support zone. However, technical indicators show a bearish continuation structure forming on the daily chart. One bearish pattern was confirmed on Jan. 20, when Bitcoin corrected toward $60,014, and a second bear flag has developed since Feb. 8, rejecting multiple rally attempts at resistance.

    Analysts emphasize that a multi-day close above $76,000 is necessary to invalidate the bearish structure. Ideally, this would include two to three consecutive daily closes above that level, followed by a successful retest around $75,000, confirming a resistance to support flip.

    Key Support Levels and Liquidation Risks in Focus

    Market technician Aksel Kibar has warned that a breakdown below the lower boundary of the current pattern could push Bitcoin toward $52,500. Data tracking leveraged positions also highlights increased liquidation risk if Bitcoin falls into the $63,000 to $65,000 range, where a concentration of long positions is located.

    Market demand across spot and futures markets remains relatively flat, with aggregated open interest staying below $20 billion, a level last seen in early February when Bitcoin traded near $79,000. Below the current support range, a liquidity gap exists until roughly $57,500 to $56,000, where the next cluster of margin positions begins.

    Until a strong catalyst emerges, analysts expect Bitcoin to continue consolidating within its broad range, with $60,000 acting as critical support and $70,000 remaining a major resistance barrier.

    Disclaimer

    This content is for informational purposes only and does not constitute financial, investment, or legal advice. Cryptocurrency trading involves risk and may result in financial loss.

  • Bitcoin Faces Holiday Weekend Risk as ETF and CME Demand Pauses

    Bitcoin Faces Holiday Weekend Risk as ETF and CME Demand Pauses

    Bitcoin traded near $66,700 heading into the Good Friday long weekend, with markets preparing for reduced liquidity as institutional trading channels temporarily shut down. Futures trading on the Chicago Mercantile Exchange will pause, and exchange-traded fund creation and redemption activity will also halt, removing a major source of buying support.

    The timing is critical as Bitcoin’s $65,000 support level appears increasingly fragile. Despite strong institutional accumulation in recent weeks, overall demand has turned negative, raising concerns about short-term price stability.

    Large Holder Selling Offsets Institutional Buying

    Recent market data showed ETF purchases reached about 50,000 BTC in the past 30 days, the highest level since October 2025. At the same time, Strategy accumulated roughly 44,000 BTC. However, overall demand remained weak, with 30-day apparent demand estimated at negative 63,000 BTC.

    Large holders controlling 1,000 to 10,000 BTC shifted into net selling, with their one-year balance change falling to negative 188,000 BTC from positive 200,000 BTC at the 2024 peak. Mid-sized holders also slowed accumulation, while a negative Coinbase Premium signaled weak U.S. spot demand.

    Inflation Data and Holiday Liquidity Could Shape Price Direction

    With institutional flows paused during the holiday, Bitcoin will rely mainly on spot markets. Analysts expect resistance between $71,500 and $81,000, while upcoming April 9 inflation data could further influence market direction if rate-cut expectations weaken.

    Disclaimer

    This content is for informational purposes only and does not constitute financial, investment, or legal advice. Cryptocurrency trading involves risk and may result in financial loss.

  • Bitcoin Miner Riot Sells 3,778 BTC in Q1 as Profitability Pressures Mount

    Bitcoin Miner Riot Sells 3,778 BTC in Q1 as Profitability Pressures Mount

    Riot Platforms sold 3,778 Bitcoin during the first quarter as mining profitability faced pressure from rising operating costs and market volatility. The company reported that the Bitcoin was sold at an average price of $76,626, generating about $289.5 million in total proceeds.

    During the same period, Riot produced 1,473 Bitcoin and held 15,680 Bitcoin on its balance sheet at the end of Q1. Blockchain intelligence platform Arkham also flagged a 500 Bitcoin outflow from a wallet linked to Riot on Thursday, indicating continued movement of funds. Bitcoin traded near $66,867 on Friday, below the average level at which Riot sold its holdings.

    Mining Firms Increase Bitcoin Sales as Energy Costs Rise

    Riot’s sales add to a broader wave of selling across the mining sector. In the past week, MARA Holdings, Genius Group, and Nakamoto Holdings reported combined Bitcoin sales totaling 15,501 BTC, with most of the volume coming from MARA.

    Bitcoin miner Riot Platforms sold 3,778 Bitcoin in the first quarter but still has 15,680 on its books: Riot Platforms

    Industry participants attribute the trend to rising energy costs linked to higher oil prices following escalating conflict in the Middle East, forcing miners to sell Bitcoin to cover operational expenses.

    Disclaimer

    This content is for informational purposes only and does not constitute financial, investment, or legal advice. Cryptocurrency trading involves risk and may result in financial loss.

  • Bitcoin Bear Market Could Require More Months of Consolidation

    Bitcoin Bear Market Could Require More Months of Consolidation

    Bitcoin is trading below $66,000, down over 3% in the past 24 hours and roughly 45% below its October all-time high, marking nearly six months of a bear market. Investors are increasingly focused on two key questions: how much lower can bitcoin fall, and how long will this bear market continue.

    $BTC daily price chart

    Price Pain vs. Time Pain

    Market challenges are not only about sharp drawdowns, known as price pain, but also slow-moving, range-bound trading, referred to as time pain. Price pain forces participants out of positions during sudden volatility, while time pain tests investor endurance as markets remain directionless for extended periods.

    Long-Term Holder Dynamics

    Realized Cap HODL Waves data groups bitcoin supply based on the last time coins moved and weights them by realized price. Currently, long-term holders those holding bitcoin for six months or more control around 80% of the total supply. Historical patterns indicate bear market bottoms coincide with long-term holders controlling about 85% of supply. This suggests that although the price floor may be forming, several months of sideways trading could still be ahead.

    Implications for Investors

    Long-term holders appear to be accumulating at depressed prices, which historically signals stabilization. However, past cycles show that while price bottoms may form first, it often takes months for long-term holder supply to reach peak levels. This indicates that investors should expect continued consolidation before a sustained recovery begins.

    Disclaimer

    This content is for informational purposes only and does not constitute financial, investment, or legal advice. Cryptocurrency trading involves risk and may result in financial loss.

  • Bitcoin Dips Below $66K as Crowded Shorts Signal Potential Upside Risk Ahead of Easter

    Bitcoin Dips Below $66K as Crowded Shorts Signal Potential Upside Risk Ahead of Easter

    Bitcoin has slipped below $66,000, trading around $65,973, down 3.7% in 24 hours. Analysts note that the market remains rangebound between roughly $60,000 and $70,000, with no clear catalyst for a breakout. Ether has also remained pinned near $2,000, reflecting a cautious sentiment across major cryptocurrencies.

    Spot demand is absorbing selling pressure but not strong enough to push prices higher. Approximately 8–9 million BTC remain held above current levels, creating an overhead resistance that caps rallies. Long-term holders are realizing losses at elevated prices, indicating that a redistribution phase is ongoing.

    Derivatives Positioning Raises Squeeze Risk

    Funding rates remain negative, with traders paying a premium to maintain short positions. Analysts at Bitfinex warned that this extended short bias could trigger a squeeze if upward momentum develops. Options activity has cooled, with implied volatility compressing and skew slightly favoring downside protection, signaling cautious hedging.

    Global disruptions in energy and metals supply chains are contributing to inflationary pressures, placing additional restraint on markets. Analysts describe the current period as “supply chain destruction,” making Bitcoin act as a residual risk barometer. Liquidity is concentrated around $69,000–$70,100 on the upside and $65,500 on the downside.

    Traders are entering the Easter holiday with heightened caution, following Bitcoin’s weakest first quarter since 2018.

    Disclaimer

    This content is for informational purposes only and does not constitute financial, investment, or legal advice. Cryptocurrency trading involves risk and may result in financial loss.

  • Crypto Markets Fall as Oil Prices Surge and Bearish Positions Increase

    Crypto Markets Fall as Oil Prices Surge and Bearish Positions Increase

    Crypto markets moved sharply lower as renewed geopolitical tensions pushed oil prices higher and triggered a broad risk-off reaction across global markets. Bitcoin traded near $66,700 after losing about 2.4% of its value since midnight UTC, giving back a significant portion of its recent gains.

    $BTC 3h price chart

    Ether recorded deeper losses, falling 4.4% as investors reacted to growing uncertainty. The decline followed statements from US President Donald Trump indicating that military strikes in Iran would continue, which intensified market concerns and weakened sentiment across risk assets.

    $ETH 4h price chart

    Oil Surge and Equity Losses Weigh on Risk Assets

    The escalation in tensions led to a sharp rise in oil prices, with Brent crude increasing by around 10% to $108 per barrel. At the same time, equity futures weakened, with Nasdaq 100 futures dropping 1.5% and S&P 500 futures falling 1.1%. The US dollar also strengthened by 0.5%, moving above the 100-point level, reinforcing pressure on crypto and other risk-sensitive markets.

    Bearish Derivatives Data Signals Continued Downside Risk

    Market data shows traders increasing bearish positions in crypto derivatives. Bitcoin funding rates dropped to their most negative levels since March 12, while open interest increased, indicating growing short activity. Ether funding rates turned the most negative since October last year, showing strong downside expectations.

    Almost $400 million in futures positions were liquidated due to margin shortfalls, representing a 16% rise compared with the previous day. Despite the decline, implied volatility remained stable, suggesting traders are seeking downside protection rather than panic selling.

    Disclaimer

    This content is for informational purposes only and does not constitute financial, investment, or legal advice. Cryptocurrency trading involves risk and may result in financial loss.

  • Bitcoin and Risk Assets React to Trump’s Iran Rhetoric, But Real Signals Lie Elsewhere

    Bitcoin and Risk Assets React to Trump’s Iran Rhetoric, But Real Signals Lie Elsewhere

    Bitcoin and other risk assets have been volatile amid Donald Trump’s shifting rhetoric on Iran. Traders react to each statement peace comments lift markets while hawkish remarks push them down—but political noise is masking real-world fundamentals.

    Strategic Petroleum Reserves Near Depletion

    The International Energy Agency coordinated a historic release of 426 million barrels from strategic petroleum reserves to offset a 4.5–5 million barrel per day shortfall caused by near-total disruption of the Strait of Hormuz. Analysts warn these reserves may be exhausted within weeks, potentially doubling the supply deficit to 10–11 million barrels per day. The Saudi Arabia called this “a shock of unprecedented scale with no obvious buffer left to absorb it.”

    Shipping and Insurance Signals

    Insurance premiums for tanker passage through Hormuz have surged from under 1% of ship value to as high as 7.5%, meaning a $100 million ship now pays $2–3 million per trip. Normalized premiums below 2% would indicate safer passage. Meanwhile, tanker traffic remains critically low, with only 21 transits since the conflict began compared to over 100 daily before the war.

    Traders relying on political statements may be misled. Sustainable rallies in Bitcoin Bitcoin and other risk assets depend on actual oil market conditions, insurance premiums, and shipping traffic returning to normal. Until then, geopolitical headlines will likely continue driving short-term volatility.

    Disclaimer

    This content is for informational purposes only and does not constitute financial, investment, or legal advice. Cryptocurrency trading involves risk and may result in financial loss.

  • Bitcoin, Ether, Solana Slide as Trump Threatens Iran “Extremely Hard”

    Bitcoin, Ether, Solana Slide as Trump Threatens Iran “Extremely Hard”

    Major cryptocurrencies fell sharply after Donald Trump’s primetime address signaled a tougher stance toward Iran, undermining a short-lived global market rally. Bitcoin dropped 2.2% to $66,609, giving back gains from Tuesday. Ether fell 2.2% to $2,056, BNB declined 3.9% to $591, XRP lost 2.5%.

    $BTC 4h price chart

    Global Equities and Oil Prices Impacted

    Trump’s speech offered no path to de-escalation. Brent crude jumped 5% to above $106 a barrel. Asian shares fell 2.1%, while U.S. and European equity futures dropped more than 1.2%. The US dollar strengthened, and Treasuries declined amid inflation concerns. The Strait of Hormuz, closed since mid-March, would reopen “naturally” after hostilities, but no timeline was given.

    Brent crufe 4h price chart

    Bitcoin’s Volatility and Seasonal Outlook

    Bitcoin has traded between roughly $60,000 and $73,000 over five weeks, reacting sharply to conflict headlines. The Fear and Greed Index remains at 12, signaling extreme fear. Analysts note April is historically strong for Bitcoin, with an average gain of 20.9% in positive years. The cryptocurrency also rebounded off two-month uptrend support near $60,000 and is attempting to reclaim its 50-day moving average.

    Despite seasonal optimism, traders warn that geopolitical escalation dominates market movements. The pattern of rallies and reversals over the past five weeks is expected to continue until the conflict itself shows signs of resolution.

    Disclaimer

    This content is for informational purposes only and does not constitute financial, investment, or legal advice. Cryptocurrency trading involves risk and may result in financial loss.

  • Bitcoin Falls and Oil Surges Above $104 as Trump Signals Escalation in Iran Conflict

    Bitcoin Falls and Oil Surges Above $104 as Trump Signals Escalation in Iran Conflict

    Bitcoin prices declined while crude oil surged above $100 per barrel following a national address by Donald Trump regarding the ongoing conflict with Iran. During the speech, the president stated that US forces were “very close” to completing military objectives under Operation Epic Fury and warned that Iran would be hit “extremely hard” over the next two to three weeks.

    $BTC 4h

    Crude oil prices climbed to approximately $105.59 per barrel after the address, reflecting rising supply concerns linked to tensions in the Strait of Hormuz. Meanwhile, Bitcoin dropped roughly 2.5%, trading near $66,604 as market uncertainty increased.

    BRENT crude 4h chart

    Middle East Conflict Drives Market Volatility

    The conflict intensified earlier in February after joint strikes by the United States and Israel, prompting Iran to impose a blockade on the Strait of Hormuz, one of the world’s most critical oil transport routes. The blockade disrupted supply expectations and added upward pressure to global energy prices.

    Trump stated that discussions between both sides remain ongoing, with the US demanding the dismantling of Iran’s nuclear programs, restoration of commercial shipping channels and an end to regional proxy support. Iran, in contrast, is seeking compensation for damages, a permanent end to the war and removal of US military presence.

    Outlook for Oil, Bitcoin and Financial Markets

    The president suggested that once the conflict ends, oil shipments through the Strait of Hormuz will resume naturally, potentially lowering fuel costs and stabilizing financial markets. He also predicted that stock markets would recover as tensions ease and trade flows normalize.

    However, the short-term outlook remains uncertain as geopolitical risks continue to influence commodity prices, cryptocurrency valuations and broader investor sentiment.

    Disclaimer

    This content is for informational purposes only and does not constitute financial, investment, or legal advice. Cryptocurrency trading involves risk and may result in financial loss.

  • Bitcoin Falls 24% in Q1 2026, Worst First Quarter Since 2018

    Bitcoin Falls 24% in Q1 2026, Worst First Quarter Since 2018

    Bitcoin ended the first quarter of 2026 down 23.8%, closing at $66,619, marking its worst Q1 performance since 2018. The decline extends losses from Q4 2025, when bitcoin dropped 23% from $114,057 to $87,508, resulting in a six-month decline of about 41.6%.

    Factors Driving the Decline

    Analysts cited several factors contributing to bitcoin’s first-quarter fall. ETF outflows played a significant role, with spot bitcoin ETFs seeing $496.5 million in net outflows during Q1, including $1.8 billion in the first two months, partially offset by $1.32 billion inflows in March. Macro uncertainty, sticky inflation, and cautious Federal Reserve policy further weighed on the cryptocurrency market.

    Geopolitical tensions in the Middle East also pressured investor sentiment, with ongoing U.S.-Iran conflicts creating market uncertainty.

    Long-Term Bitcoin Outlook

    Despite the recent decline, analysts note that long-term conviction in bitcoin remains strong, with institutional adoption and participation trends largely intact. Recovery in Q2 2026 will likely depend on renewed ETF inflows, clearer crypto regulations, and stabilization of geopolitical conditions.

    Disclaimer

    This content is for informational purposes only and does not constitute financial, investment, or legal advice. Cryptocurrency trading involves risk and may result in financial loss.