Category: Bitcoin news

  • Oil Drops Below $96 While Bitcoin Surges Above 72k — Is the BTC Breakout Real?

    Oil Drops Below $96 While Bitcoin Surges Above 72k — Is the BTC Breakout Real?

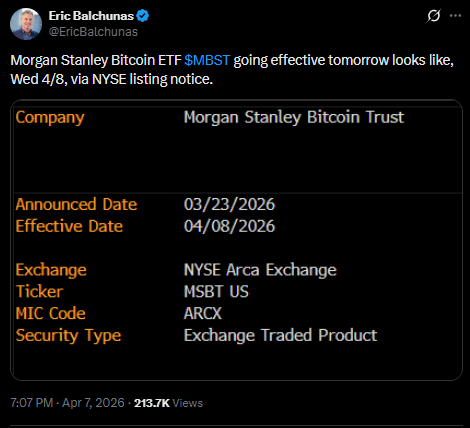
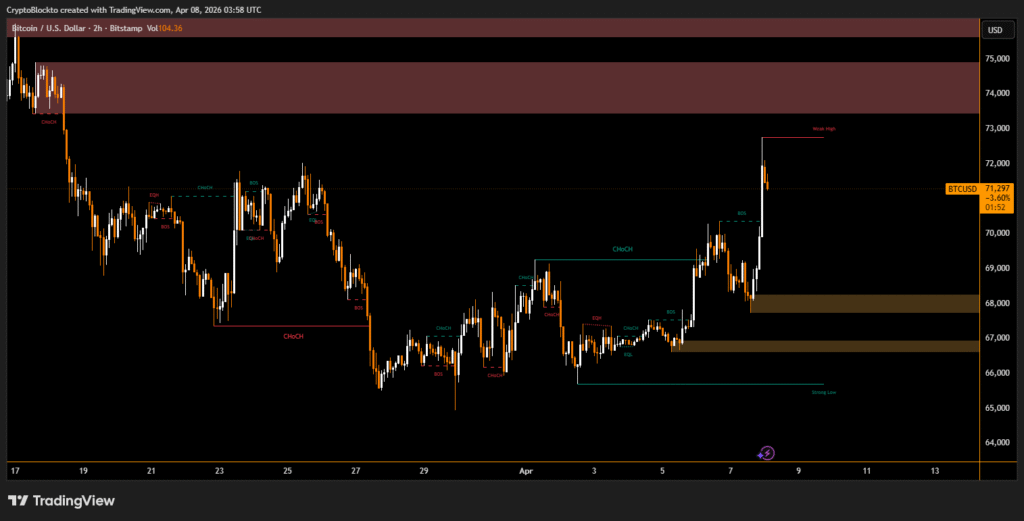
    Bitcoin price jumped sharply toward $72,700 during New York trading after US President Donald Trump confirmed a two week ceasefire agreement with Iran, triggering a steep decline in global oil prices. The sudden shift in geopolitical tension helped fuel renewed demand across crypto markets.

    Bitcoin Rebounds 7% as Short Liquidations Exceed $431 Million

    Market data showed BTC climbed about 7.4%, rising from $67,274 to $72,760, marking its highest level in three weeks. The last time Bitcoin traded above $72,000 was on March 18.

    $BTC 2h price chart

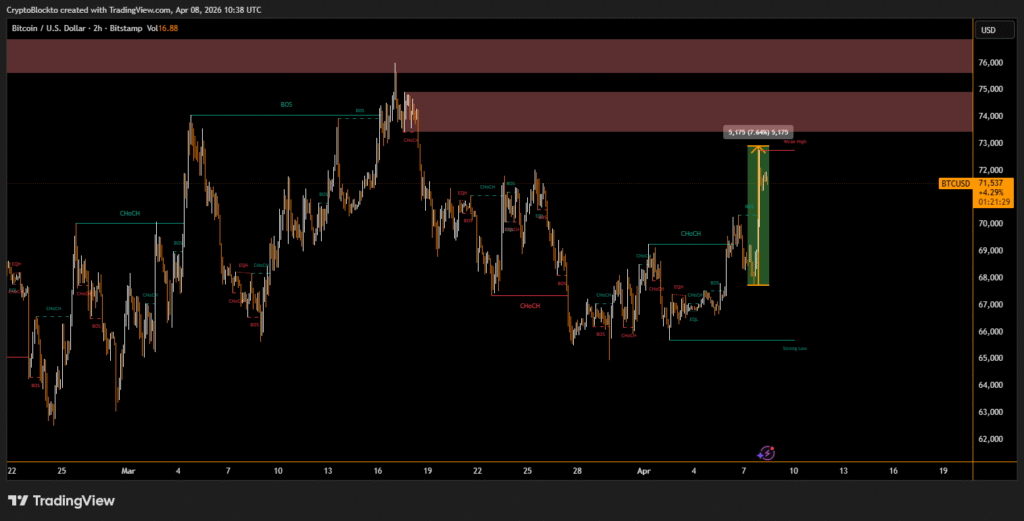
    The rally triggered large liquidations across derivatives markets, with $431 million in short positions wiped out in 24 hours. Bitcoin-related short liquidations alone totaled $214.8 million, while overall crypto liquidations reached $610 million.

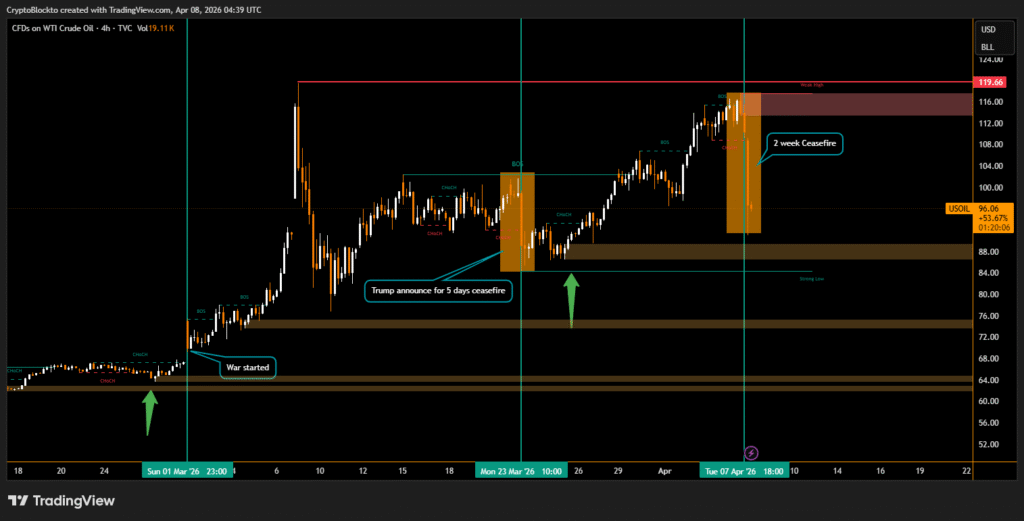
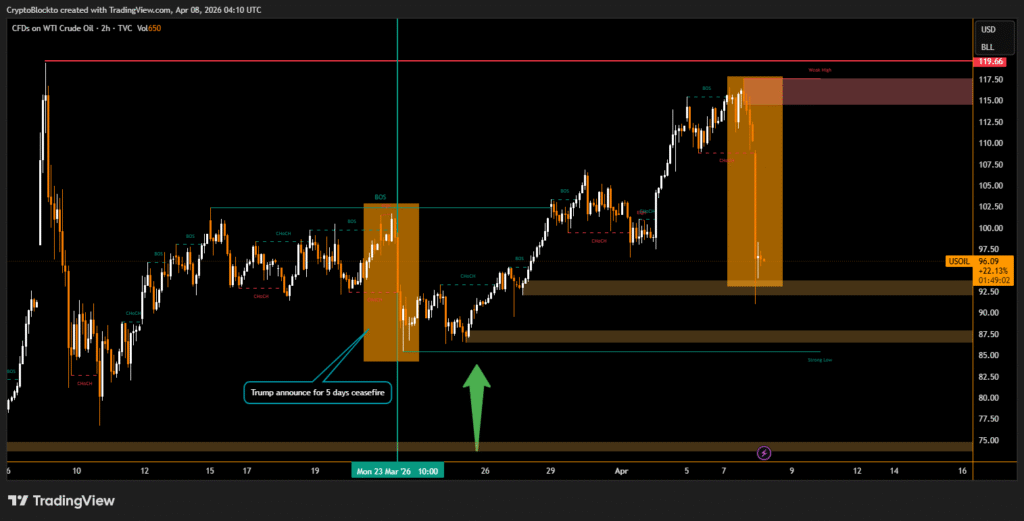
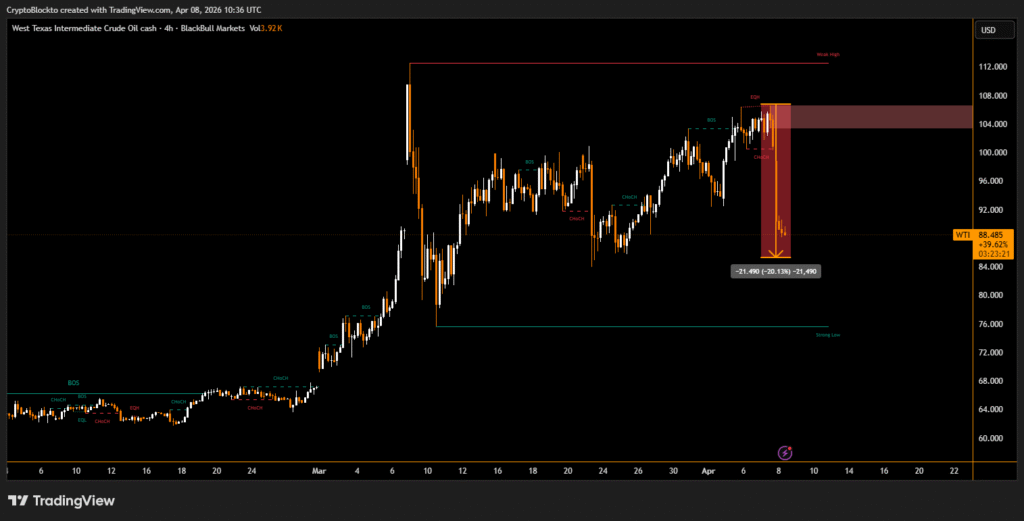
    Oil Price Crash Supports Crypto Market Momentum

    Oil prices dropped sharply after the ceasefire announcement. Crude, which had surged between $110 and $118 per barrel, fell by nearly 16% to around $92, while WTI crude declined to $91 before stabilizing near $95.

    CFDs on WTI crude oil 4h chart

    Trading firm QCP Capital warned that market optimism remains fragile, citing ongoing uncertainty around infrastructure damage and upcoming diplomatic talks.

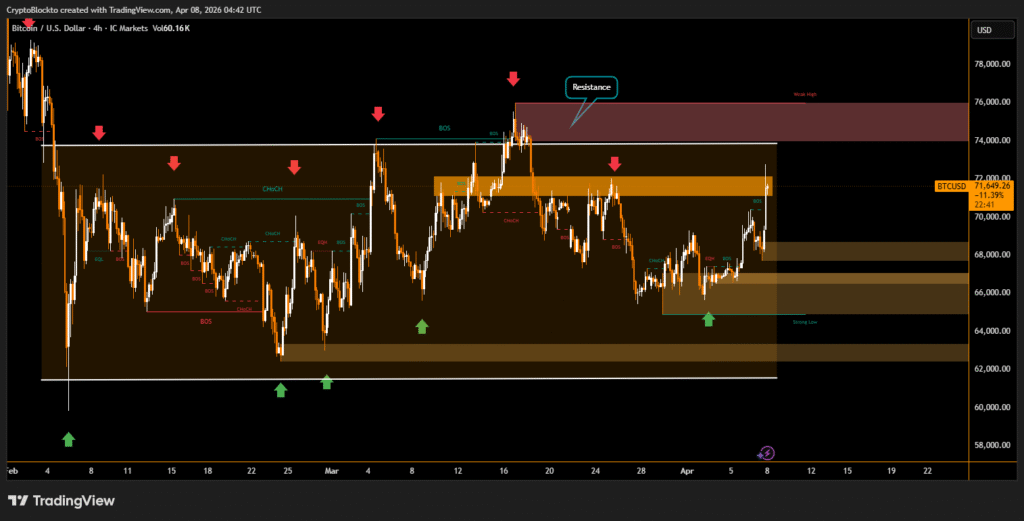
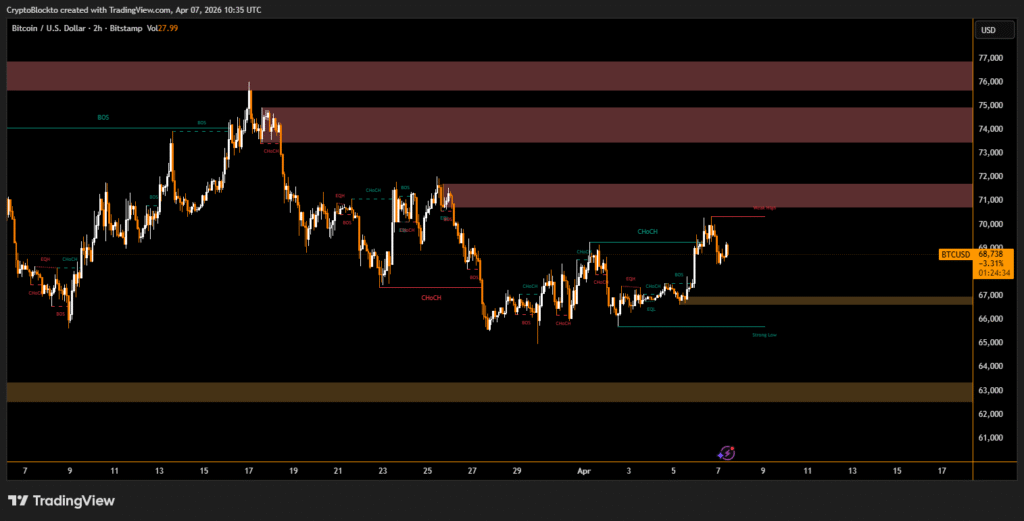
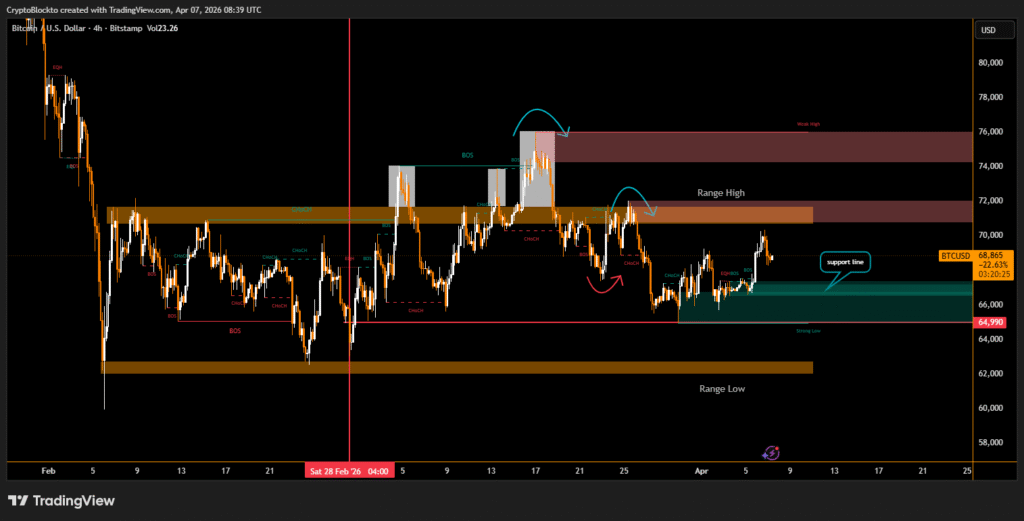
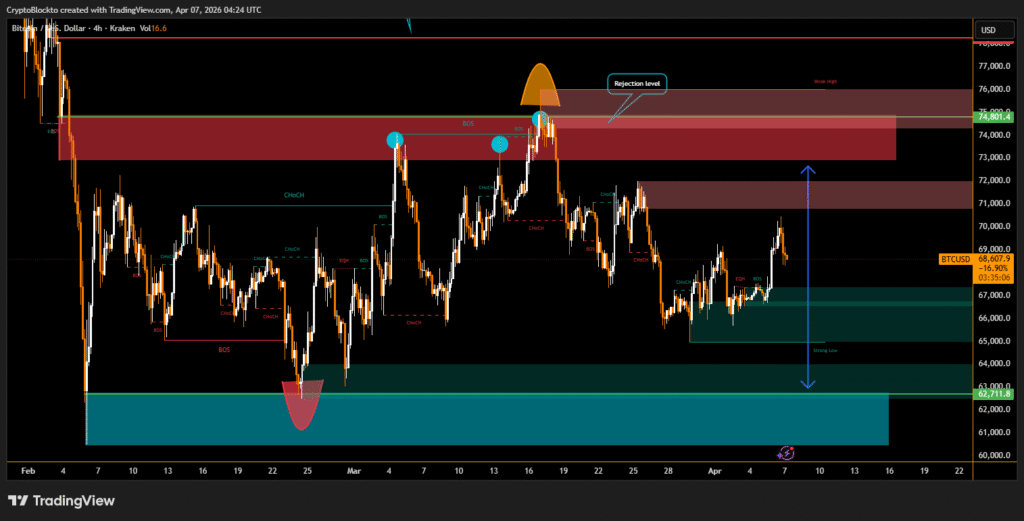
    Bitcoin Faces Resistance Between $72K and $76K

    Despite the rally, traders remain cautious about a sustained breakout. Bitcoin bulls still face strong resistance within the $72,000–$76,000 range, describing the pattern as a potential bearish flag.

    $BTC daily price chart

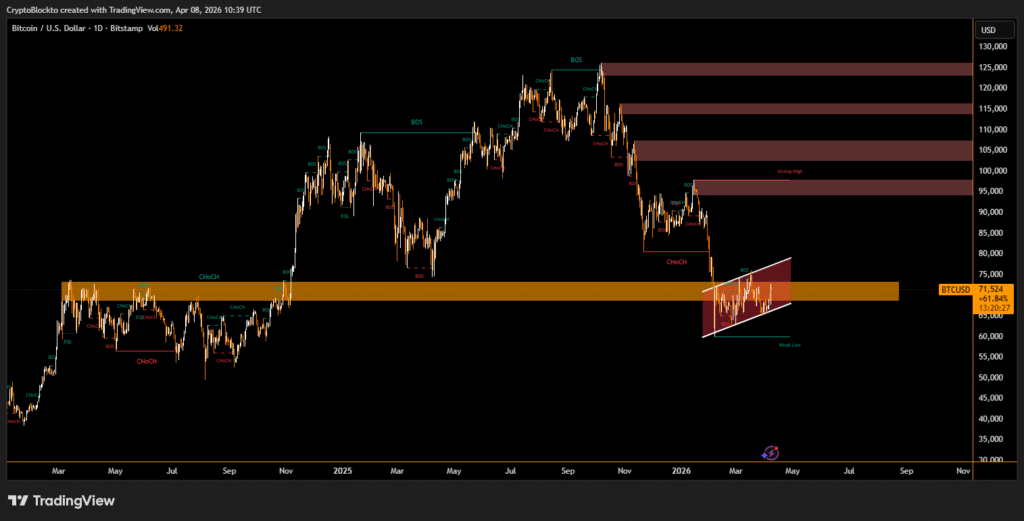
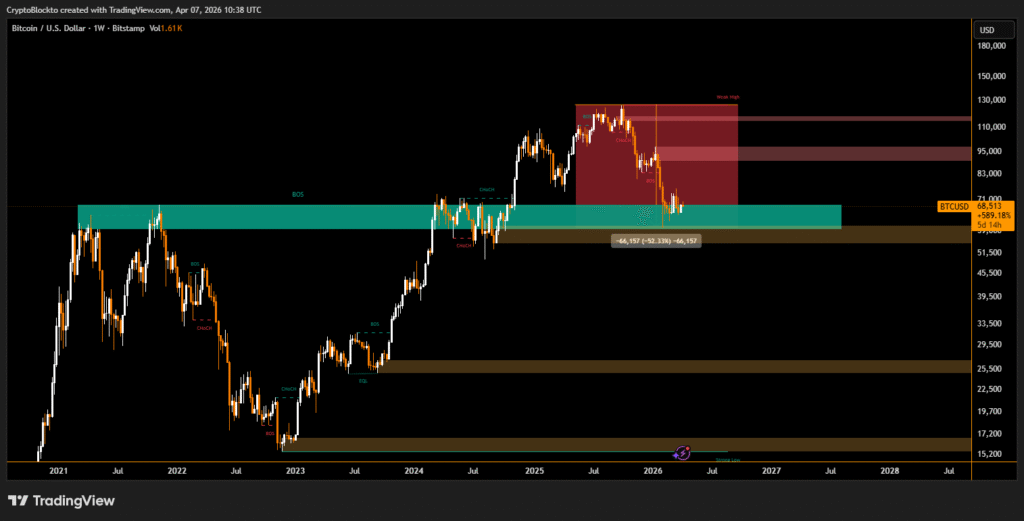
    High timeframe close above $76,000 could push Bitcoin toward $86,000–$90,000, while rejection at that level could send prices below $60,000. Many traders are also watching long term indicators such as the 200-week moving average, historically linked to bear market bottoms.

    Disclaimer

    This content is for informational purposes only and does not constitute financial, investment, or legal advice. Cryptocurrency trading involves risk and may result in financial loss.

  • Morgan Stanley Set to Launch First Spot Bitcoin ETF From Major U.S. Bank

    Morgan Stanley Set to Launch First Spot Bitcoin ETF From Major U.S. Bank

    Morgan Stanley is preparing to launch the Morgan Stanley Bitcoin Trust, the first spot bitcoin ETF issued by a top tier U.S. bank. The fund could start trading as early as Wednesday on NYSE Arca under the ticker MSBT, marking a milestone in institutional bitcoin adoption.

    Key Features of the Morgan Stanley Bitcoin Trust

    The ETF will hold actual bitcoin, tracking the 4 PM NY Settlement Rate. Unlike leveraged or derivative-based funds, it will not actively trade to outperform bitcoin’s price movements. BNY and Coinbase Custody will handle bitcoin storage, providing secure, institutional-grade safekeeping.

    The fund is launching with about $1 million in initial capital and 50,000 shares available for trading. Investors gain direct exposure to bitcoin without managing the cryptocurrency themselves.

    A major advantage is cost: the trust charges a 0.14% annual fee, undercutting BlackRock’s iShares Bitcoin Trust, which charges 0.25%, making it one of the most affordable bitcoin ETFs available.

    Impact on Institutional Adoption and Market Trends

    The launch reinforces Morgan Stanley’s broader push into digital assets. Earlier this year, the bank filed for spot Solana ETFs and plans to enable trading in bitcoin, ethereum, and Solana on ETrade through a partnership with Zero Hash.

    Bloomberg’s ETF Analyst Eric Balchunas said on X;

    Since the first 11 spot bitcoin ETFs launched in January 2024, these funds have collectively attracted more than $56 billion in net inflows, reflecting growing institutional demand. Spot ETFs have also contributed to stabilizing bitcoin volatility, with BTC’s implied volatility increasingly mirroring Wall Street indicators like the VIX.

    Morgan Stanley’s ETF is expected to continue these trends, further mainstreaming bitcoin investment and strengthening the role of traditional financial institutions in the cryptocurrency market.

    Disclaimer

    This content is for informational purposes only and does not constitute financial, investment, or legal advice. Cryptocurrency trading involves risk and may result in financial loss.

  • Bitcoin, Ether and Oil Shorts Trigger $427 Million Liquidation After Ceasefire Rally

    Bitcoin, Ether and Oil Shorts Trigger $427 Million Liquidation After Ceasefire Rally

    Short sellers across crypto and commodity markets suffered heavy losses after bitcoin surged past $72,700 following confirmation of a two-week ceasefire between the United States and Iran. The rapid market reversal wiped out about $595 million in total leveraged positions across 118,489 traders within 24 hours.

    $BTC 4h price chart

    Short positions accounted for roughly $427 million of the liquidations, compared with $168 million in long positions, highlighting how heavily markets were positioned for continued downside before the announcement. The largest single liquidation recorded was an $11.79 million BTC-USDT short position on Binance. Bitcoin led losses with about $245 million in liquidations, followed by ether at $126 million. Tokenized Brent oil futures added $33 million, while WTI crude contracts contributed another $42 million as oil prices dropped sharply.

    Oil Price Drop and Market Sentiment Intensify Liquidations

    Oil markets reversed direction as geopolitical risk eased, with Wti crude falling to around $91 per barrel and West Texas Intermediate declining to approximately $95. The sharp move affected tokenized commodity trades, including positions tied to silver and gold, which were also caught in the unwind.

    USOIL 4h price chart

    Most of the losses occurred within a 12-hour window, where $508 million in positions were liquidated, including $398 million in short trades. This marked the most aggressive short squeeze since March 4, when bitcoin rallied during earlier ceasefire speculation. Solana recorded $19.6 million in liquidations.

    Ceasefire News Shifts Market Direction and Tests Bitcoin Range

    The market reaction followed an announcement by Donald Trump, who described the agreement as a “double sided ceasefire,” stating that U.S. military objectives had been achieved. Iranian officials confirmed the suspension of hostilities but noted that oil tanker movement through the Strait of Hormuz would require coordination with military forces and remain subject to technical limitations.

    Before the ceasefire announcement, market sentiment had been heavily bearish. Bitcoin’s surge placed it near the top of the $65,000 to $73,000 trading range that has defined market movement throughout the conflict, leaving traders focused on whether the ceasefire will lead to a sustained breakout or another short-term reversal.

    Disclaimer

    This content is for informational purposes only and does not constitute financial, investment, or legal advice. Cryptocurrency trading involves risk and may result in financial loss.

  • Iran Bitcoin Hashrate Plunges 77% Amid Conflict While Global Network Holds Steady

    Iran Bitcoin Hashrate Plunges 77% Amid Conflict While Global Network Holds Steady

    Iran’s Bitcoin hashrate has dropped significantly over the past quarter, falling about 77% as conflict involving the United States and Israel intensified. According to data from the Hashrate Index, the country lost roughly 7 exahashes per second quarter-over-quarter, leaving its total hashrate at around 2 EH/s. Ian Philpot, marketing director at Luxor Technology, said the decline showed a clear regional impact, though the disruption remained largely limited to Iran. Neighboring countries such as the United Arab Emirates and Oman showed no measurable decline in mining capacity.

    Iran is estimated to operate approximately 427,000 active Bitcoin mining rigs. Although tensions escalated in February following strikes and retaliatory actions, the global Bitcoin network remained stable at close to 1,000 EH/s. Philpot explained that regional disruptions typically redistribute mining power rather than eliminate it, reducing the risk of widespread network instability.

    Global Hashrate Weakness Linked to Falling Bitcoin Prices

    The global 30 day simple moving average hashrate declined from 1,066 EH/s in the first quarter to about 1,004 EH/s in the second quarter, representing a 5.8% quarter-over-quarter drop. Philpot attributed this trend primarily to declining Bitcoin prices rather than conflict or regulatory pressure. Bitcoin has fallen more than 45% from its all-time high of $126,000 recorded in October, reducing mining profitability across the sector.

    He noted that older-generation mining machines operating at efficiencies above 25 J/TH are now running at negative gross margins, forcing shutdowns. Estimates suggest around 252 EH/s of marginal capacity is currently offline as legacy hardware is retired and replaced with more efficient systems.

    Leading Countries Continue to Dominate Global Hashrate Distribution

    The United States holds the largest share of global hashrate at over 37%, followed by Russia at about 17% and China at roughly 12%, together accounting for 65.6% of the total network. Philpot added that while overall capacity among major regions remains stable, the internal mix of hardware continues to evolve, with modern equipment gradually replacing outdated machines.

    US miners contribute the largest share of global hashrate.: Hashrate Index

    Disclaimer

    This content is for informational purposes only and does not constitute financial, investment, or legal advice. Cryptocurrency trading involves risk and may result in financial loss.

  • Bitcoin Surges Above $72,000 as Ceasefire News Boosts Global Risk Assets

    Bitcoin Surges Above $72,000 as Ceasefire News Boosts Global Risk Assets

    Bitcoin surged past the $72,000 level after confirmation of a two week ceasefire between the United States and Iran, triggering a broader rally across cryptocurrency and stock futures markets. The leading cryptocurrency climbed to about $72,699, marking a 5% gain within 24 hours.

    $BTC 2h price chart

    The rally followed an announcement by Donald Trump, who stated that planned military strikes against Iran would be suspended for two weeks. He described the move as a “double sided ceasefire,” noting that military objectives had been achieved and discussions toward long-term peace were progressing. Iranian officials also confirmed the ceasefire, adding that defensive operations would pause if attacks against the country were halted.

    Stock Futures Rise While Oil Prices Drop Sharply

    Alongside bitcoin’s rise, U.S. stock futures moved higher, reflecting renewed risk appetite among investors. Futures linked to the S&P 500 advanced about 1.9%, while Nasdaq futures gained roughly 2.2%. Dow Jones futures also rose by nearly 1.8%, signaling broader optimism across financial markets.

    At the same time, oil prices dropped significantly as fears of supply disruption eased. West Texas Intermediate crude fell more than 10% to around $95 per barrel, with Brent crude recording a similar decline. Iran also indicated that oil tankers could transit the Strait of Hormuz for the next two weeks, subject to coordination with its armed forces and technical limitations.

    USOIL 2h price chart
    Disclaimer

    This content is for informational purposes only and does not constitute financial, investment, or legal advice. Cryptocurrency trading involves risk and may result in financial loss.

  • Bitcoin Diverges From Software Stocks as Iran Conflict and AI Pressures Shift Market Trends

    Bitcoin Diverges From Software Stocks as Iran Conflict and AI Pressures Shift Market Trends

    Bitcoin has started to move independently from software stocks following the outbreak of conflict involving Iran on Feb. 28, marking a sharp shift after months of close alignment. Since that date, Bitcoin has gained more than 5%, climbing back above $69k, including an increase of over 0.5% in the past 24 hours.

    $BTC 2h price chart

    In contrast, the iShares Expanded Tech-Software Sector ETF has fallen more than 2% during the same period. The performance gap signals that investors are beginning to treat cryptocurrency and software equities as separate assets in the short term.

    Correlation Breakdown Signals Market Decoupling Trend

    Correlation between Bitcoin and IGV dropped sharply after the conflict began. In early February, the relationship stood near 1.0, indicating the two assets were moving almost in lockstep. Following the outbreak, the correlation plunged to 0.13, reflecting near decoupling, before partially recovering to around 0.7.

    Over the past three months, both assets showed similar declines, with Bitcoin falling 26% and IGV losing 23%. Year to date, both remain down around 21%, while over five years Bitcoin has gained 18%, compared with 10% for IGV. Bitcoin also experienced a deeper drawdown, falling about 50% from its October all-time high, while IGV declined roughly 35% from its own peak.

    $BTC weekly price chart

    AI Pressure and Software Sector Risks Drive Divergence

    Software stocks tracked by IGV include major companies such as Microsoft, Oracle, and Salesforce. Investors are increasingly concerned that rapid growth in artificial intelligence could compress profit margins and valuation multiples across Software-as-a-Service businesses as competition rises and barriers to entry decline.

    Bitcoin, meanwhile, is behaving more like a macro-sensitive asset, drawing support from heightened geopolitical uncertainty linked to the Iran conflict, which has encouraged investors to diversify away from traditional technology equities.

    Disclaimer

    This content is for informational purposes only and does not constitute financial, investment, or legal advice. Cryptocurrency trading involves risk and may result in financial loss.

  • Bitcoin Whale Moves $20 Million to Binance Amid Market Activity

    Bitcoin Whale Moves $20 Million to Binance Amid Market Activity

    A bitcoin whale transferred approximately 300 BTC, valued at over $20 million, to a Binance deposit address on Tuesday, according to Arkham Intelligence. The wallet, labeled “bc1q…kp4n,” still retains roughly 200 BTC, worth about $13.75 million.

    Between January and March 2025, this wallet accumulated 513 BTC, valued at $50 million at the time, suggesting an average purchase price of $97,541 per bitcoin. While it is unclear if the whale intends to sell, such transfers to exchanges often indicate potential market activity. Selling now would result in a loss, with BTC trading near $68,692.

    Whale Activity Trends in Crypto Markets

    This move follows a wave of recent whale activity. Last month, a bitcoin wallet moved 2,100 BTC ($147.7 million) that had been dormant for over 13 years. Another whale transferred $33 million in BTC to Binance.

    Bitcoin edged down 0.6% in the past 24 hours, maintaining a price near $68,892. Btc remains down roughly 45% from its all-time high of $124,900, recorded in October 2025, reflecting continued volatility and active participation from large holders.

    Disclaimer

    This content is for informational purposes only and does not constitute financial, investment, or legal advice. Cryptocurrency trading involves risk and may result in financial loss.

  • Bitcoin Decline Triggers $14.5 Billion Unrealized Loss for Strategy in Q1

    Bitcoin Decline Triggers $14.5 Billion Unrealized Loss for Strategy in Q1

    Strategy Inc. recorded an unrealized loss of about $14.5 billion in the first quarter after a sharp decline in the value of its Bitcoin holdings. Bitcoin fell more than 20% during the three-month period, marking the digital asset’s steepest first-quarter decline since 2018.

    By the end of the quarter, the company held more than $50 billion in cryptocurrency, but the market downturn pushed the value of those holdings below the firm’s average purchase price of over $75,000 per Bitcoin. Updated accounting rules adopted last year require fair-value adjustments on Bitcoin holdings to be reflected directly in earnings, contributing to large swings in reported financial results.

    Recent Bitcoin Purchases and Funding Strategy

    Between April 1 and April 5, Strategy purchased 4,871 Bitcoin for approximately $330 million, at an average price of about $67,700. The acquisition was funded through sales of Class A common stock and at-the-market offerings of Stretch preferred shares.

    The company also reported a $2.42 billion deferred tax benefit during the quarter.

    Preferred Shares and Capital Strategy Outlook

    Strategy plans to raise additional funds through $21 billion in Class A stock and $21 billion in perpetual preferred shares. These preferred securities carry an 11.5% annual yield, resetting monthly to maintain a $100 par value.

    MSTR stock price chart

    While selling common stock dilutes shareholders, preferred shares create fixed financial obligations. Strategy currently holds about $2.25 billion in cash reserves, enough to cover interest and distributions for more than two years, but long-term sustainability depends on Bitcoin appreciating faster than the company’s financial commitments grow.

    Disclaimer

    This content is for informational purposes only and does not constitute financial, investment, or legal advice. Cryptocurrency trading involves risk and may result in financial loss.

  • Bitcoin ETF Inflows Surge to Highest Level $471 Million Since February

    Bitcoin ETF Inflows Surge to Highest Level $471 Million Since February

    $471 Million Enter Spot Bitcoin ETFs Amid Price Stability

    U.S. spot bitcoin ETFs recorded $471 million in net inflows on April 6, marking their largest daily intake since February and the sixth-largest of 2026, as Bitcoin hovered near $68,780. Strong ETF demand has offset weak spot buying and ongoing selling by large holders, helping stabilize bitcoin below the $70,000 level.

    BTC Etf flows since March 20

    Research indicates a shift in bitcoin’s market behavior: ETF-driven institutional flows are now front-running expected central bank actions rather than reacting afterward. According to Polymarket data, the market currently assigns a 98% probability that the Federal Reserve will hold rates steady at its April meeting.

    A Binance Research report notes that bitcoin’s correlation with the Global Easing Breadth Index tracking 41 central banks—has turned sharply negative since 2024. This suggests bitcoin may have transitioned from a “macro lagging receiver” to a “leading pricer,” with ETF inflows absorbing supply and influencing marginal pricing ahead of central bank moves.

    The combination of ETF-driven demand and weak spot accumulation by whales highlights the growing influence of institutional flows in shaping bitcoin’s near-term price dynamics.

    Disclaimer

    This content is for informational purposes only and does not constitute financial, investment, or legal advice. Cryptocurrency trading involves risk and may result in financial loss.

  • Bitcoin Slides Toward $68,000 as Whale Selling and Weak Demand Pressure Market

    Bitcoin Slides Toward $68,000 as Whale Selling and Weak Demand Pressure Market

    Bitcoin has repeatedly failed to maintain levels above $70,000 and is now retreating toward $68,000, testing the lower boundary of a $65,000–$73,000 trading range that has held since late March. On-chain data from Glassnode indicates soft trading volumes and subdued activity, signaling weak participation behind recent price moves.

    $BTC 4h prie chart

    Large holders continue distributing BTC, according to trading and liquidity firm Caladan, leaving the market reliant on macro-driven flows and derivatives positioning rather than broad based accumulation.

    Derivatives and Prediction Markets Signal Downside Risk

    Options markets show elevated implied volatility relative to realized levels, reflecting increased demand for downside protection. Analysts highlight a negative gamma setup below $68,000, where market makers may be forced to sell BTC to hedge positions, potentially accelerating a decline toward $60,000 if support fails.

    Prediction market activity on Polymarket shows traders assigning a 68% probability that BTC will trade at or below $65,000 in April, while higher targets like $80,000 have seen falling odds.

    Taken together, these trends suggest a structurally fragile market: stable for now, but vulnerable to sharp declines if key support levels break.

    Disclaimer

    This content is for informational purposes only and does not constitute financial, investment, or legal advice. Cryptocurrency trading involves risk and may result in financial loss.